Use Grafana to visualize kmesh performance monitoring
Preparation
-
Make default namespace managed by Kmesh
-
Set relevant args:
- Modify
bpf/kmesh/probes/performance_probe.hby changing#define PERF_MONITOR 0to#define PERF_MONITOR 1. - Change
--enable-perfmonitor=falseto--enable-perfmonitor=trueindeploy/yaml/kmesh.yaml.
- Modify
-
Deploy bookinfo as sample application and sleep as curl client
-
Install namespace granularity waypoint for default namespace
The above steps could refer to Install Waypoint | Kmesh
-
Deploy prometheus and garafana:
kubectl apply -f https://raw.githubusercontent.com/kmesh-net/kmesh/main/samples/addons/prometheus.yaml
kubectl apply -f https://raw.githubusercontent.com/kmesh-net/kmesh/main/samples/addons/grafana.yaml
Generate some continuous traffic between applications in the mesh
kubectl exec deploy/sleep -- sh -c "while true; do curl -s http://productpage:9080/productpage | grep reviews-v.-; sleep 1; done"
Use grafana to visualize kmesh performance monitoring
- Use the port-forward command to forward traffic to grafana:
kubectl port-forward --address 0.0.0.0 svc/grafana 3000:3000 -n kmesh-system
# Forwarding from 0.0.0.0:3000 -> 3000
-
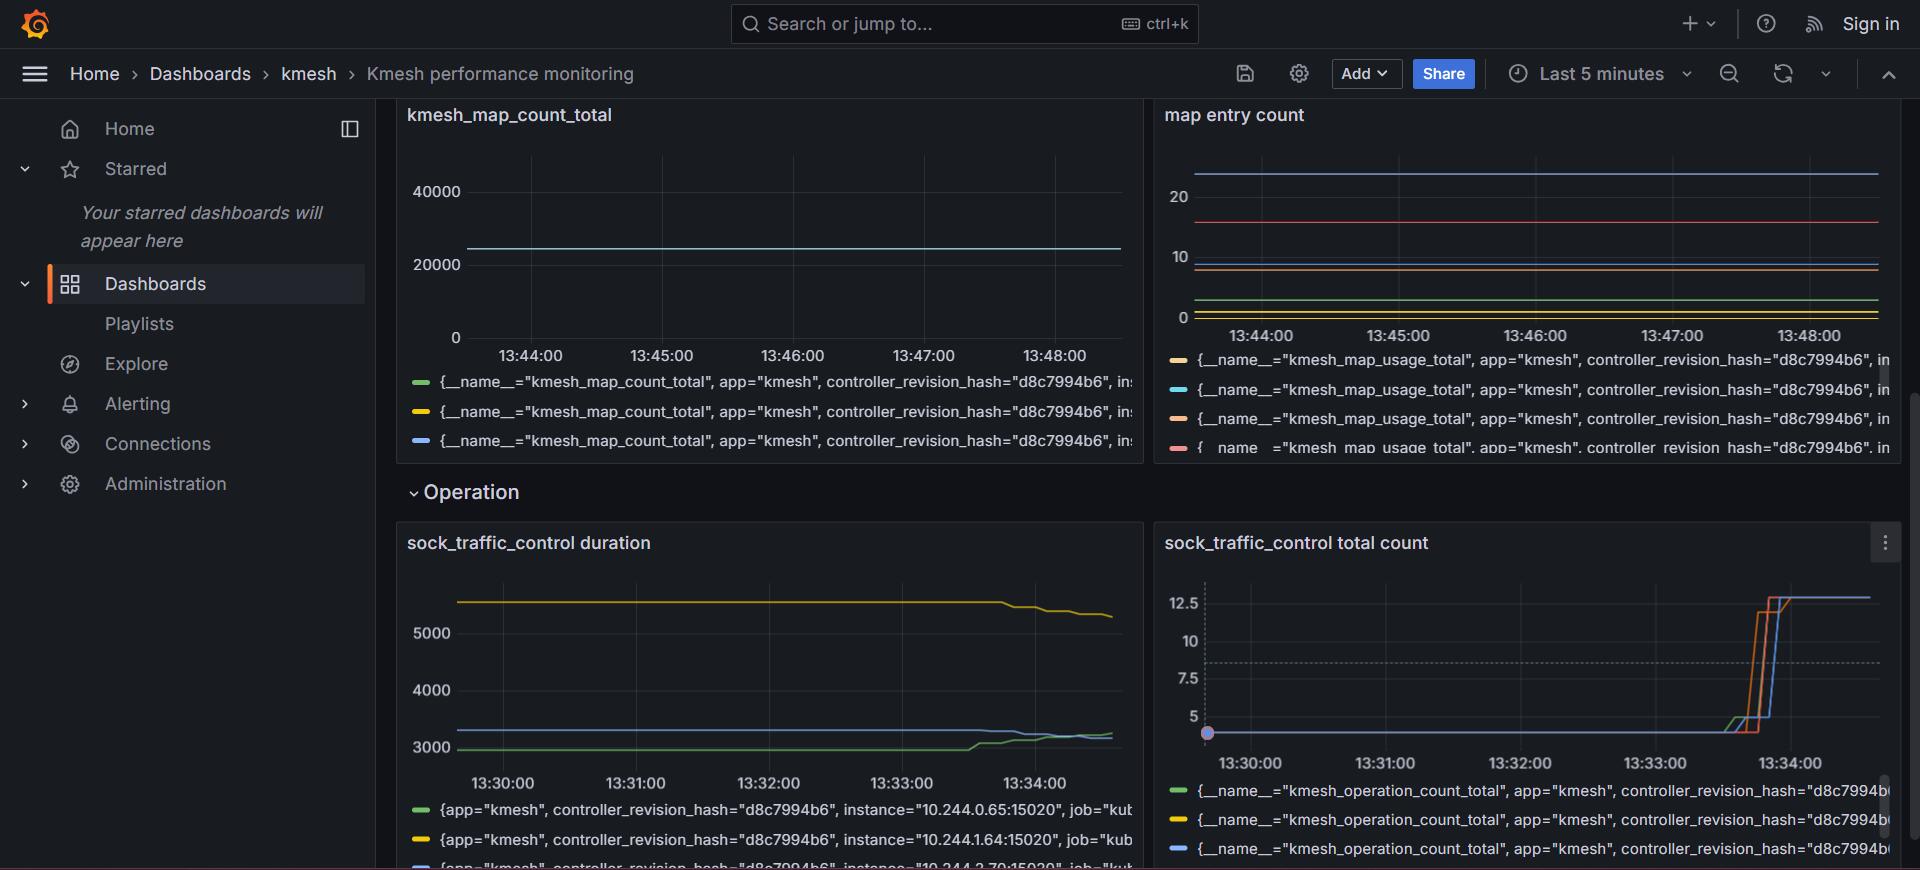
View the dashboard from browser
Visit
Dashboards > Kmesh > Kmesh performance monitoring: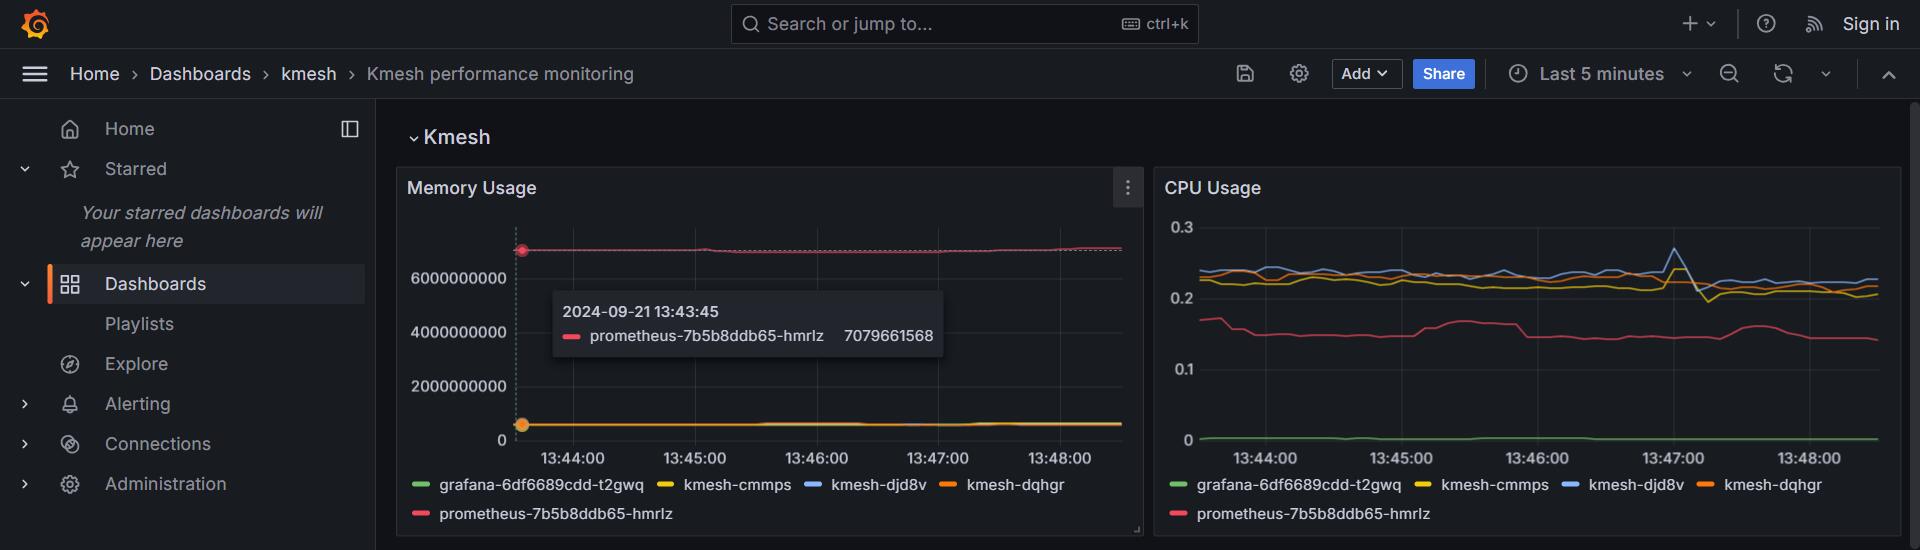
Cleanup
- Remove prometheus and grafana:
kubectl delete -f https://raw.githubusercontent.com/kmesh-net/kmesh/main/samples/addons/prometheus.yaml
kubectl delete -f https://raw.githubusercontent.com/kmesh-net/kmesh/main/samples/addons/grafana.yaml