Querying L4 Metrics from Prometheus
Preparation
1. Install Kmesh
Please refer to the quickstart guide
Note: The following should be added to the Kmesh annotation:
annotations:
  prometheus.io/path: "status/metric"
  prometheus.io/port: "15020"
  prometheus.io/scrape: "true"
2. Configure Kmesh to manage the default namespace
kubectl label namespace default istio.io/dataplane-mode=Kmesh
Expected output:
namespace/default labeled
3. Install the Prometheus Addon
Istio provides a basic sample installation to quickly get Prometheus up and running:
kubectl apply -f https://raw.githubusercontent.com/kmesh-net/kmesh/main/samples/addons/prometheus.yaml
4. Deploy the tcp-echo and sleep applications
# Deploy tcp-echo application
kubectl apply -f https://raw.githubusercontent.com/kmesh-net/kmesh/main/samples/tcp-echo/tcp-echo.yaml

# Deploy sleep application
kubectl apply -f https://raw.githubusercontent.com/kmesh-net/kmesh/main/samples/sleep/sleep.yaml

# Verify deployments
kubectl get po -A
Expected output:
NAMESPACE            NAME                                          READY   STATUS    RESTARTS   AGE
default              sleep-bc9998558-pbfvk                         1/1     Running   0          7m
default              tcp-echo-7f676db574-mzmql                     1/1     Running   0          7m
Important: Confirm that sleep and tcp-echo are indeed managed by kmesh.
Querying Metrics from Prometheus
Available Metrics
Metrics monitored by Kmesh L4 at this stage:
Workload Metrics
Give information about traffic behavior and performance between workloads.
| Name | Description |
|---|---|
kmesh_tcp_workload_connections_opened_total | The total number of TCP connections opened to a workload |
kmesh_tcp_workload_connections_closed_total | The total number of TCP connections closed to a workload |
kmesh_tcp_workload_received_bytes_total | The size of the total number of bytes received in response to a workload over a TCP connection |
kmesh_tcp_workload_sent_bytes_total | The size of the total number of bytes sent in response to a workload over a TCP connection |
kmesh_tcp_workload_conntections_failed_total | The total number of TCP connections failed to a workload |
kmesh_tcp_retrans_total | Total number of retransmissions of the workload over the TCP connection |
kmesh_tcp_packet_loss_total | Total number of TCP packets lost between source and destination workload |
Service Metrics
Give information about traffic behavior and performance between services.
| Name | Description |
|---|---|
kmesh_tcp_connections_opened_total | The total number of TCP connections opened to a service |
kmesh_tcp_connections_closed_total | The total number of TCP connections closed to a service |
kmesh_tcp_received_bytes_total | The size of the total number of bytes received in response to a service over a TCP connection |
kmesh_tcp_sent_bytes_total | The size of the total number of bytes sent in response to a service over a TCP connection |
kmesh_tcp_conntections_failed_total | The total number of TCP connections failed to a service |
Connection Metrics
Give information about traffic behavior and performance of a established tcp connection(duration > 30 seconds). These metrics are particularly valuable in clusters running workloads that establish long-lived TCP connections, such as databases, message brokers, audio/video streaming services, AI applications etc.
| Name | Description |
|---|---|
kmesh_tcp_connection_sent_bytes_total | The total number of bytes sent over established TCP connection |
kmesh_tcp_connection_received_bytes_total | The total number of bytes received over established TCP connection |
kmesh_tcp_connection_packet_lost_total | Total number of packets lost during transmission in a TCP connection |
kmesh_tcp_connection_retrans_total | The total number of retransmits over established TCP connection |
Querying Steps
Here's how to view these metrics through Prometheus:
1. Verify that the Prometheus service is running in your cluster
In Kubernetes environment, execute the following command:
kubectl -n kmesh-system get svc prometheus
Expected output:
NAME         TYPE        CLUSTER-IP     EXTERNAL-IP   PORT(S)    AGE
prometheus   ClusterIP   10.96.18.252   <none>        9090/TCP   24h
2. Establish a TCP connection between applications in the mesh
Create a TCP link between sleep and tcp-echo with the nc command:
kubectl exec "$(kubectl get pod -l app=sleep -o jsonpath={.items..metadata.name})" \
  -c sleep -- sh -c 'echo "port 9000" | nc tcp-echo 9000' | grep "hello" && \
  echo 'connection succeeded' || echo 'connection rejected'
Expected output:
hello port 9000
connection succeeded
3. Open the Prometheus UI
Use the port-forward command to forward the traffic to Prometheus:
kubectl port-forward --address 0.0.0.0 svc/prometheus 9090:9090 -n kmesh-system
Expected output:
Forwarding from 0.0.0.0:9090 -> 9090
Handling connection for 9090
Handling connection for 9090
4. Execute a Prometheus query
In the "Expression" input box at the top of the web page, enter the text:
kmesh_tcp_connections_opened_total
The results will be similar to:
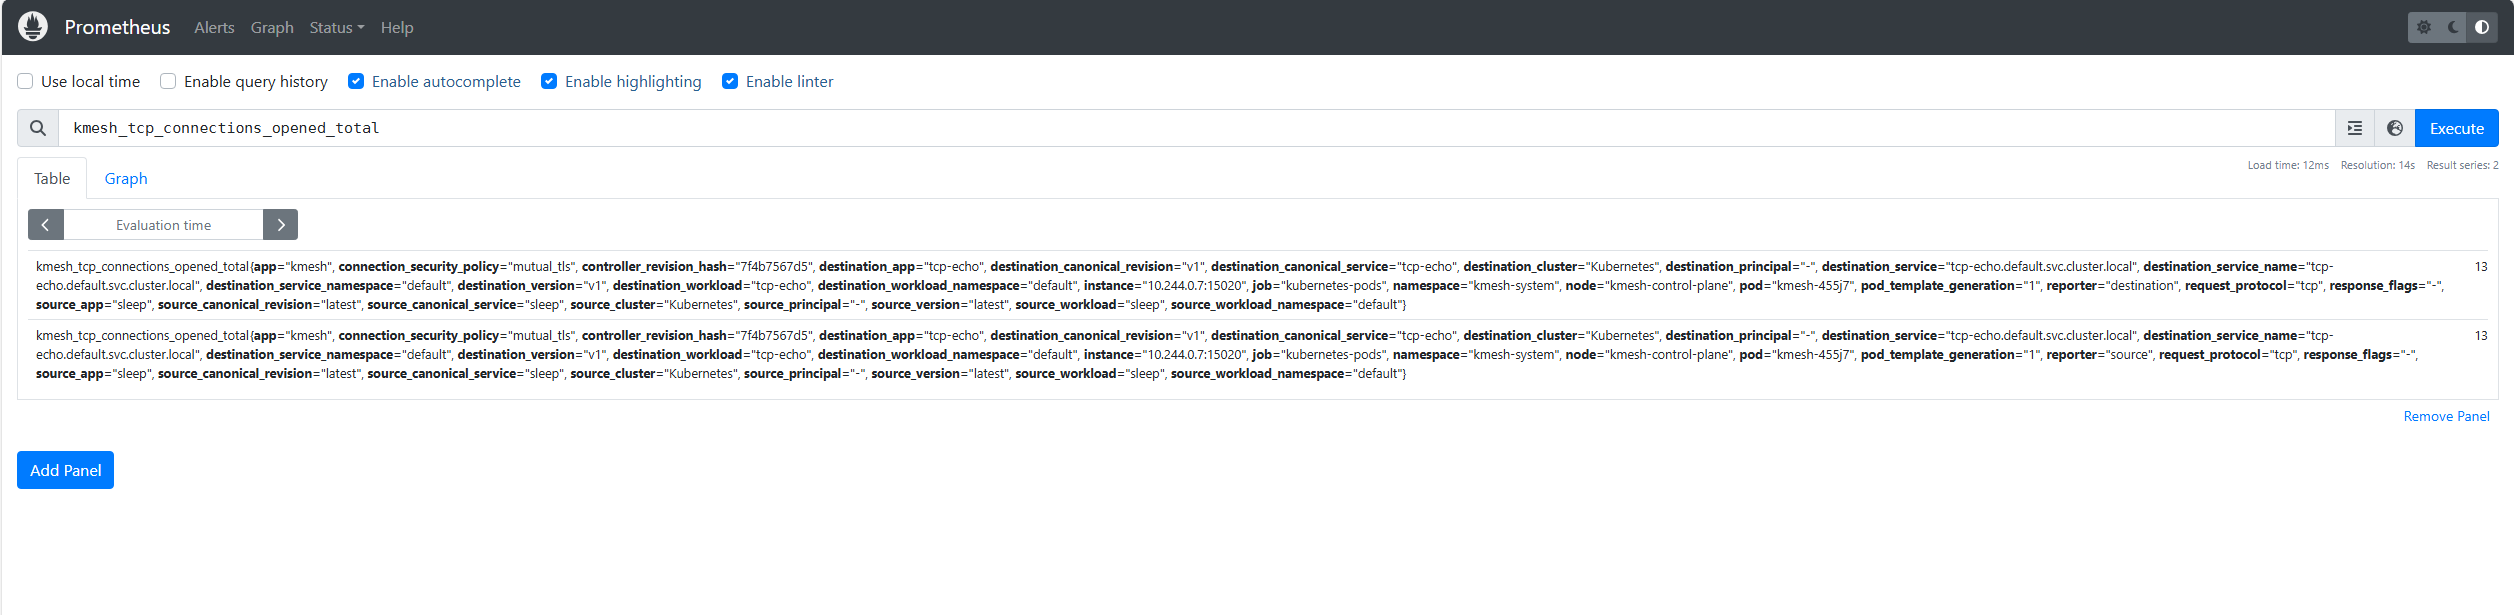
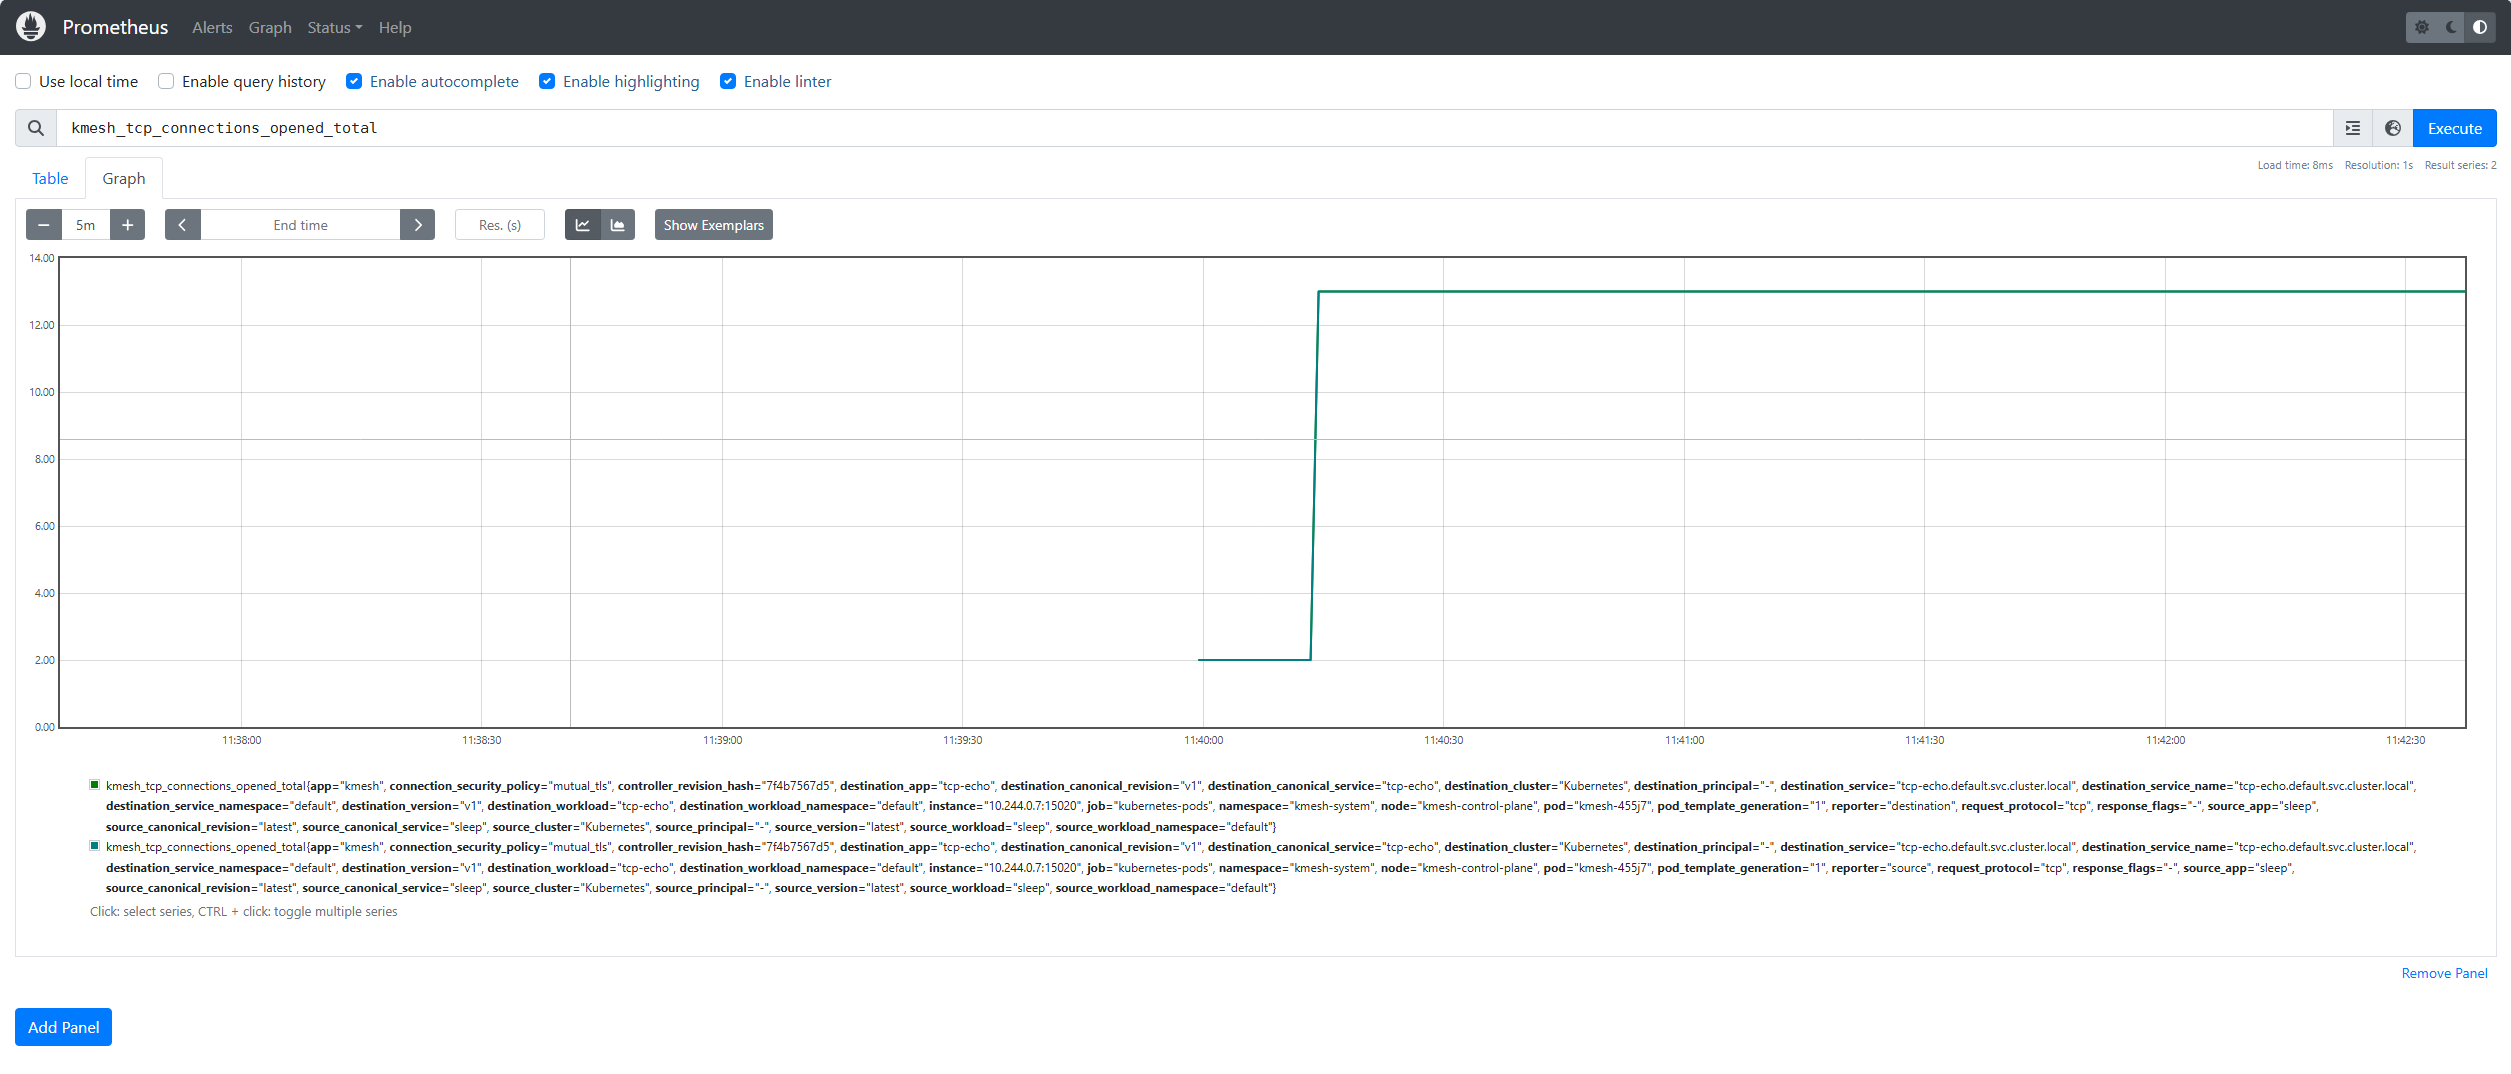
You can also see the query results graphically by selecting the Graph tab underneath the Execute button.
Cleanup
-
Disable port-forward.
-
Cleanup Prometheus:
kubectl delete -f https://raw.githubusercontent.com/kmesh-net/kmesh/main/samples/addons/prometheus.yaml
If you are not planning to explore any follow-on tasks, refer to the quickstart cleanup instructions to shutdown the application.